The global manufacturing landscape is highly competitive, and manufacturers are focused on delivering high-quality parts. To deliver high-quality parts consistently, it is crucial to identify, analyze, and avoid defects promptly, which can be supported through the implementation of a statistical process control tool.
Statistical process control enables manufacturers to monitor, analyze, and control process variations in real time, thereby driving continuous improvement and ensuring consistency in product quality. In this article, we discuss various types of statistical process control tools, their implementation, and their role in manufacturing in detail.

SPC, abbreviated for Statistical Process Control, is a systematic and organized approach applied to monitor and regulate manufacturing processes. It employs certain statistical techniques, which can monitor either specific or all the activities of the manufacturing processes. You can also identify and address any internal issues. The proactive approach of statistical process control enables manufacturers to reduce defects, maintain process standards, and optimize efficiency.
Statistical process control tool collects and analyzes real-time data at various stages to ensure that all the manufacturing processes are consistent and efficient. Since statistical process control tools analyze data at various manufacturing stages, they can identify any deviations from the standard, thereby allowing prompt implementation of corrective actions.
Statistical process control creates control charts to visualize data trends and thereby indicate variations that require attention. Statistical process control tools trigger various manufacturing machines and instruments to provide quality data from product measurements and process readings, which is further evaluated and monitored to control particular processes.
SPC is a key component of initial process studies, which is an element of PPAP, i.e., Production Part Approval Process. It is included in the initial process studies and is often a part of PPAP submissions in the form of control charts.
PPAP submission includes detailed SPC data to demonstrate that the manufacturer can consistently deliver high-quality parts that are as per the expectations of the customer. SPC data in PPAP submissions also demonstrates the capability and stability of the process. It is thus a key aspect of the initial process studies that support PPAP submissions. You can read more about PPAP here.
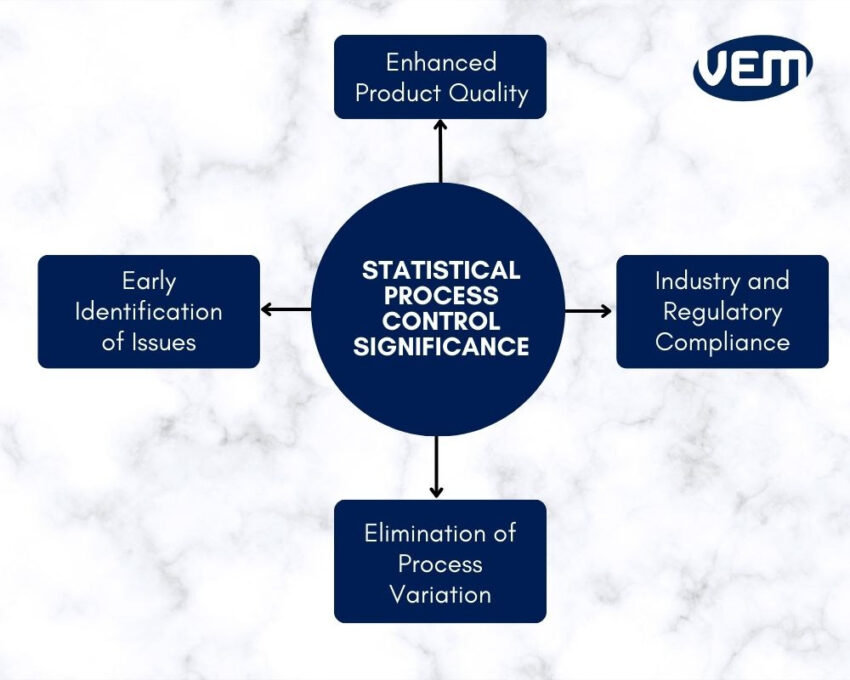
Statistical process control reduces rework. One of the major advantages of the statistical process control tool is that it helps streamline processes, which makes it easier to identify issues and immediately correct them. This helps to lower the risk of defects, thereby eliminating rework.
Since statistical process control tools identify issues early on, it’s possible to correct these issues as well, which further helps create a continuous process that optimizes product quality.
Statistical control process tools, such as software and charts, help to identify irregular patterns, which helps to identify and eliminate any process variations.
Statistical process tools facilitate compliance with both industry and regulatory requirements.
Implementing the statistical control process system in manufacturing can take an initial investment of time. In addition, monitoring and chart-filling are time-consuming processes.
Statistical process control systems need to be integrated into an existing framework. This requires the personnel to undergo extensive training on the systems so that they are well-versed with the statistical process control tool.
Statistical process control is an expensive investment. Typically, the manufacturing company undertakes a contract with a service provider to invest in training resources and materials.
SPC software plays a crucial role in manufacturing high-quality plastic parts. It indicates when the production processes aren’t within the control limits. This is especially crucial for industries where precision and consistency are non-negotiable. For instance: aerospace, automotive, medical devices, consumer electronics, etc.
SPC software for manufacturing helps to detect early deviations and reduce scrap rates. It minimizes rework with real-time data monitoring and analytics. This is especially helpful in manufacturing, as even the slightest variations in temperature, pressure, or mold fill times can affect product integrity. SPC software provides immediate insights to maintain part quality batch after batch.
In plastic part manufacturing, SPC software is applied to monitor various variables such as mold cavity pressure, cycle time, cooling time, and dimensional measurements. By setting control limits upon these and other parameters, the operators are alerted to any change outside the control limits and are thus able to avoid defects.
The implementation of SPC software for manufacturing is a proactive and predictive approach that helps to ensure process stability and compliance. This is particularly crucial for high-volume production runs, where undetected defects could lead to large recalls or create customer dissatisfaction.
SPC software for manufacturing enables continuous improvement. SPC software collects data over time, which can be used to identify recurring trends, root causes of variability, and opportunities for process optimization. This not only helps in manufacturing high-quality parts but also supports lean manufacturing principles, which reduce costs and improve customer satisfaction. It also enhances traceability and simplifies compliance with international quality standards such as ISO 9001 or IATF 16949.
SPC software for manufacturing plastic parts is a cornerstone for quality assurance. It transforms raw production data into actionable insights, which further enables manufacturers to deliver high-precision, defect-free products.
Investing in the right software solution is a strategic advantage, and in this section, we understand some of the popular SPC software solutions:
Statistical process control tools enable manufacturers to identify and analyze variations so that corrective actions can be undertaken. It’s an excellent system to implement changes and understand if these changes are creating improvements. SPC tools enable you to achieve the following:
Cause and effect diagrams are also referred to as the Ishikawa diagram. It is also popularly known as the fishbone diagram because it looks like a fishbone, where the main bone stretches into smaller branches. These smaller branches delve deeper into each cause. The following diagram shows a fishbone diagram:
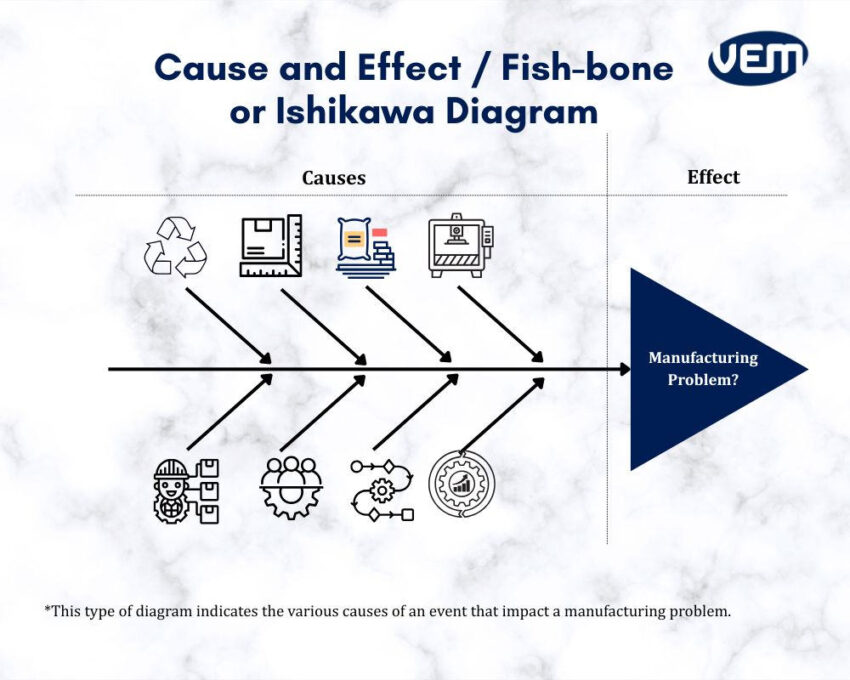
These types of diagrams are particularly used to identify the various causes of an issue or a problem.
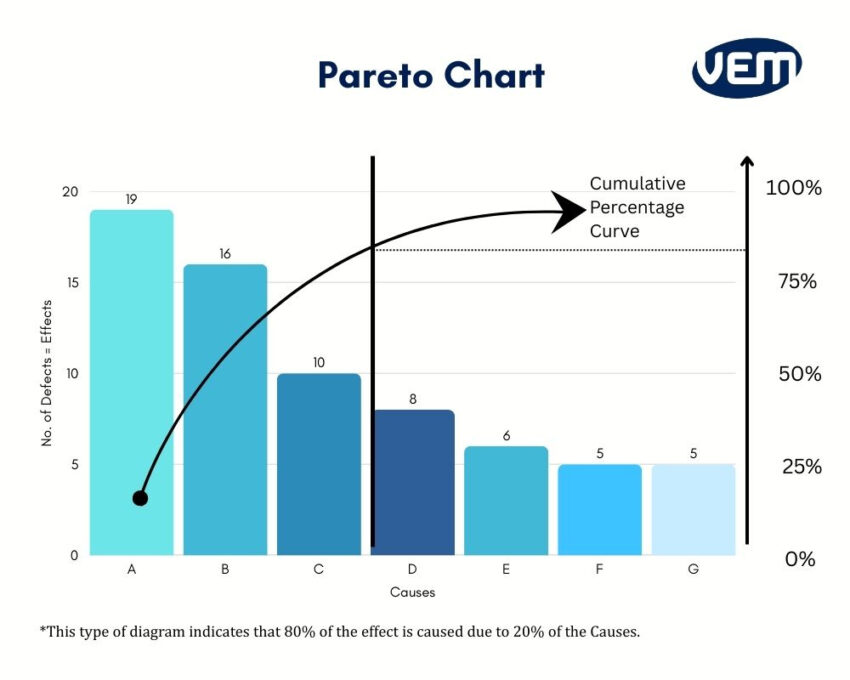
A Pareto chart demonstrates data through bar graphs and line charts. Pareto charts are often used along with the 80/20 principle, i.e., approximately 20 % of the causes are responsible for 80 % of the effect, i.e., a specific problem or problems in manufacturing. The following diagram indicates an example of a Pareto chart in manufacturing:
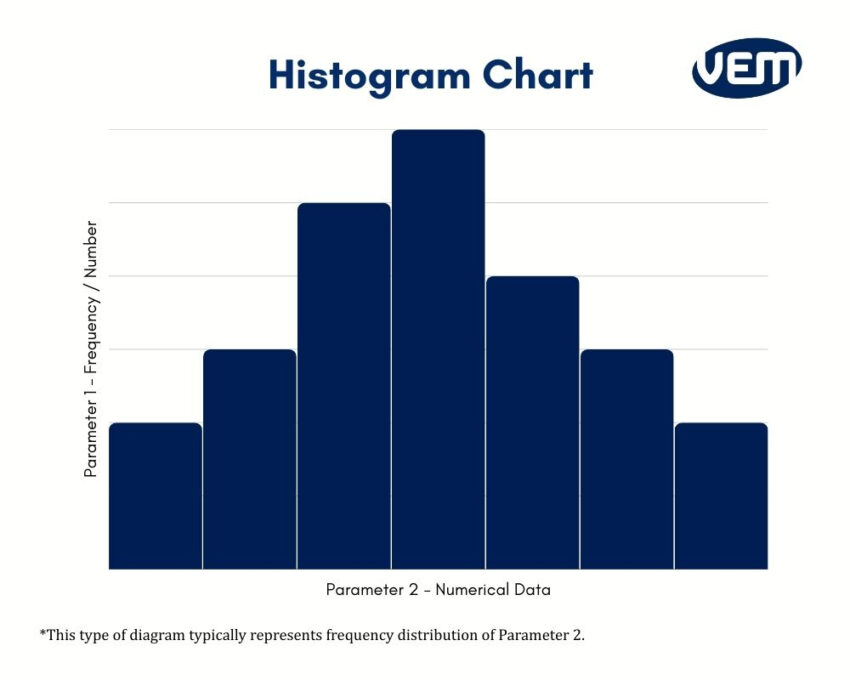
Histograms are graphs. They represent frequency distributions and are ideal for numerical data. The image below depicts a histogram chart:
Check sheets are simple, ready-to-use forms. They are collected to be analyzed.
It’s typically applied to data that is under repetitive observation and is either collected by the same operator or in the same location.
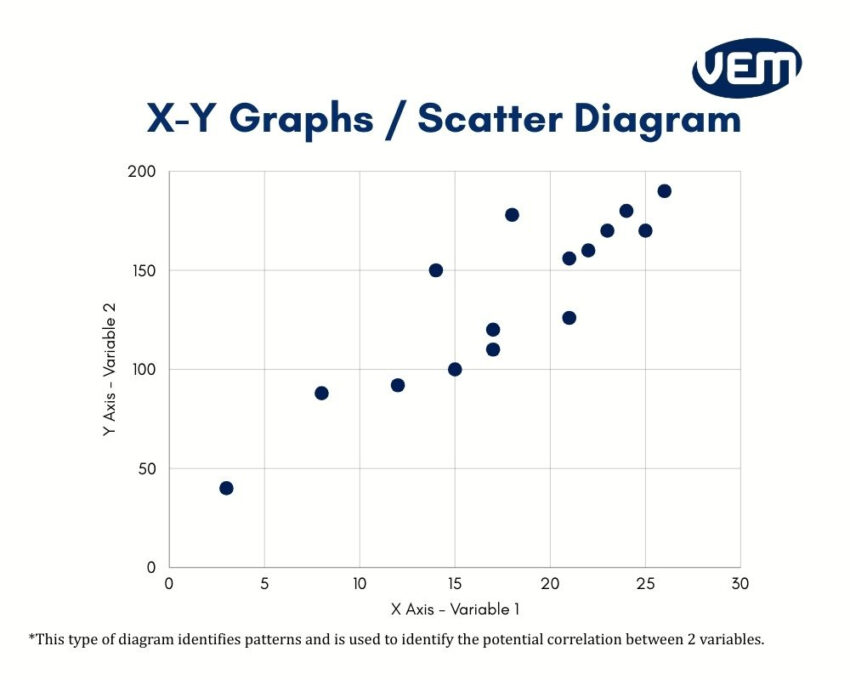
Scatter diagrams, also known as X-Y graphs, are apt for analyzing numerical data. It is typically used in manufacturing to identify patterns and potential correlations between 2 variables. For instance, Is a change in the pressure increasing the number of defects?
Stratification tools separate data so that pattern identification can be further simplified. It is apt to segregate data from various sources. These tools separate data into layers or specific groups.
Defect maps visualize and track a product’s defects. They focus on physical locations and defects that are identified on the map.
Progress centers are centralized locations that enable data collection. They also monitor progress so that decisive actions can be taken.
Event logs are standardized records. They are used to record key software and hardware events.
Process flowcharts illustrate process steps. They are displayed in the order they occur.
Randomization is a type of supplemental tool that makes use of chance to assign manufacturing units to a treatment group.
This type of supplemental tool determines the number of individuals or events that should be included in the statistical analysis.
Statistical process control analyzes data, which is why it is essential to determine which data to collect.
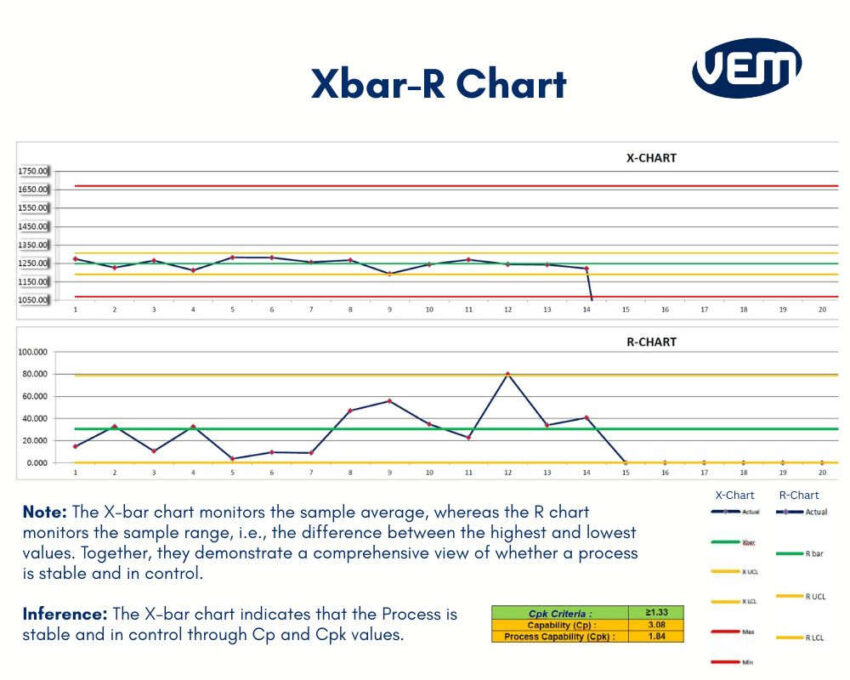
The collected data is tracked through control charts. There are various types of control charts, and it is imperative to implement the correct control chart. The control charts are segregated into 2 categories, and they are distinguished by the data type: Variable or Attribute.
Variable data is data that comes from measurements on a continuous scale. For instance: weight, temperature, time, etc. The following chart types measure variable data:
Attribute data is based on discrete distinctions, such as good or bad, or a percentage. The following charts analyze attribute data:
It is also crucial to qualify the measurement system to ensure that the measurement error is within an acceptable range. You should note that if the measurement error exceeds an acceptable level, then the data is unreliable.
The next step is to analyze the collected data. When analyzing and inferring the data, the following key aspects should be taken into account:
Special causes in data analysis indicate that there is a change that has had a huge impact on the process. If a special cause is identified, then necessary action needs to be taken to determine the cause.
Some common examples that can lead to variations are a change in material properties, humidity levels, operator inexperience, typical measurement variations, wear and tear of machines and tools.
Statistical process control determines whether a process is consistent, and this is indicated when data points that are recorded on a control chart fall between the control limits. In this section, we delve into understanding what control limits in data analysis are.
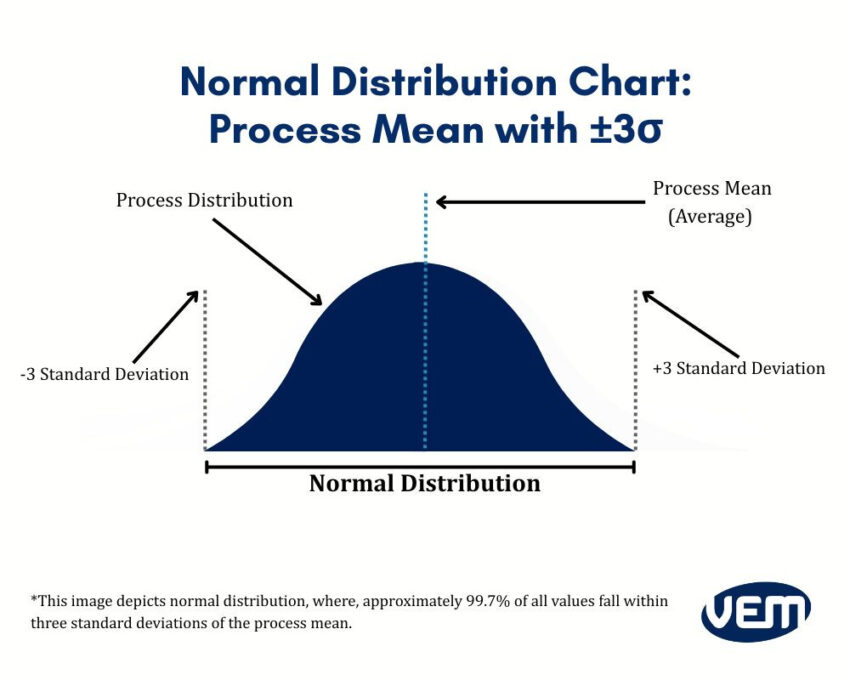
In statistical process control, typically, statistical tables demonstrate how the data is distributed, which is most often referred to as the normal distribution. To understand distribution in statistical process control, it is imperative to have a measurement for data dispersion, or spread, which can be expressed through the highest and the lowest range. It is also referred to as standard deviation, i.e., Sigma.
In a normal distribution, about 99.7% of values fall within three standard deviations of the average, i.e., the process mean. This leaves just 0.3% of values outside these limits. Such points are highly unlikely, so when a measurement falls beyond 3 standard deviations, i.e., ±3σ, it indicates that the process may have shifted or become more variable, and action may be required.
Process Capability is a process’s ability to meet the specifications. You should note that specifications are the delivery expectations of the process. It’s measured by the following indices:
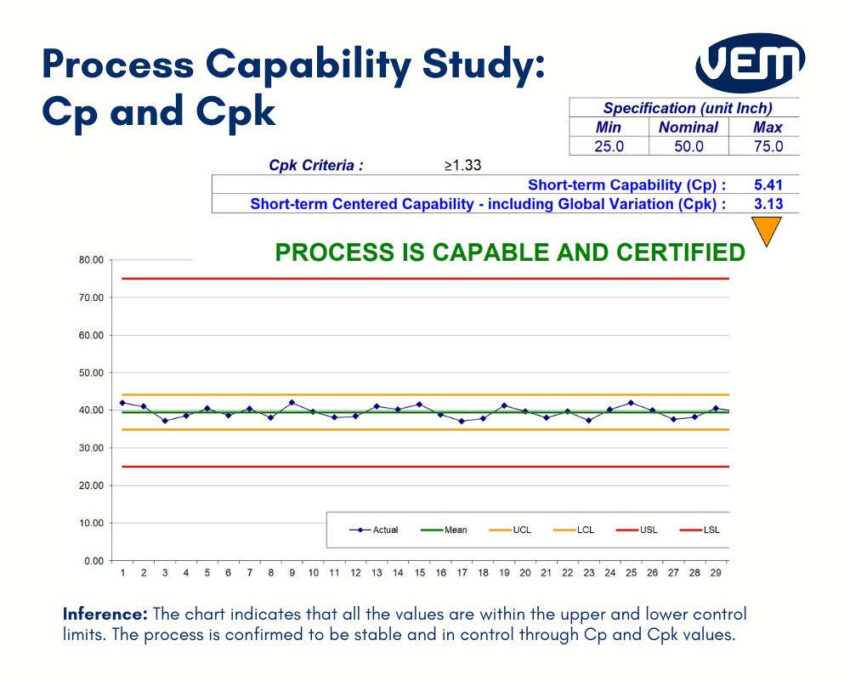
You should note that the process capability analysis requires that the process be normally distributed.
The next step is to continually monitor the process to verify whether the data are within control limits and watch for trends or sudden changes in the process. If any special causes of variation are identified, appropriate action should be taken to determine the cause.
Once the control limits are established, you need to assess whether or not the process is in control. You should note that the upper and lower control limits are 3 standard deviations on either side of the average. When one or more points are outside 3 standard deviations, then it’s considered to be an out-of-control condition.
When an out-of-control condition is discovered, the root cause is investigated. Once the root cause is identified, specific actions are implemented, which improves the process stability.
Statistical process control may require a substantial time and resource investment, but its accurate data analysis optimizes process efficiency and improves product development. It addresses shifts in trends and processes that can positively impact process efficiency.
VEM Tooling has over 20 years of experience in providing manufacturing solutions. At VEM-Tooling, we have a fully qualified management system and are ISO 9001:2015 certified for our various factories. We can help you implement SPC tools and other manufacturing solutions.
To provide the best experiences, we use technologies like cookies to store and/or access device information. Consenting to these technologies will allow us to process data such as browsing behavior or unique IDs on this site. Not consenting or withdrawing consent, may adversely affect certain features and functions.